工作流中支持使用 <echarts_rander></echarts_rander> 渲染 echarts 图表,该标签需要搭配函数库的函数进行使用。
1 Echart 图表
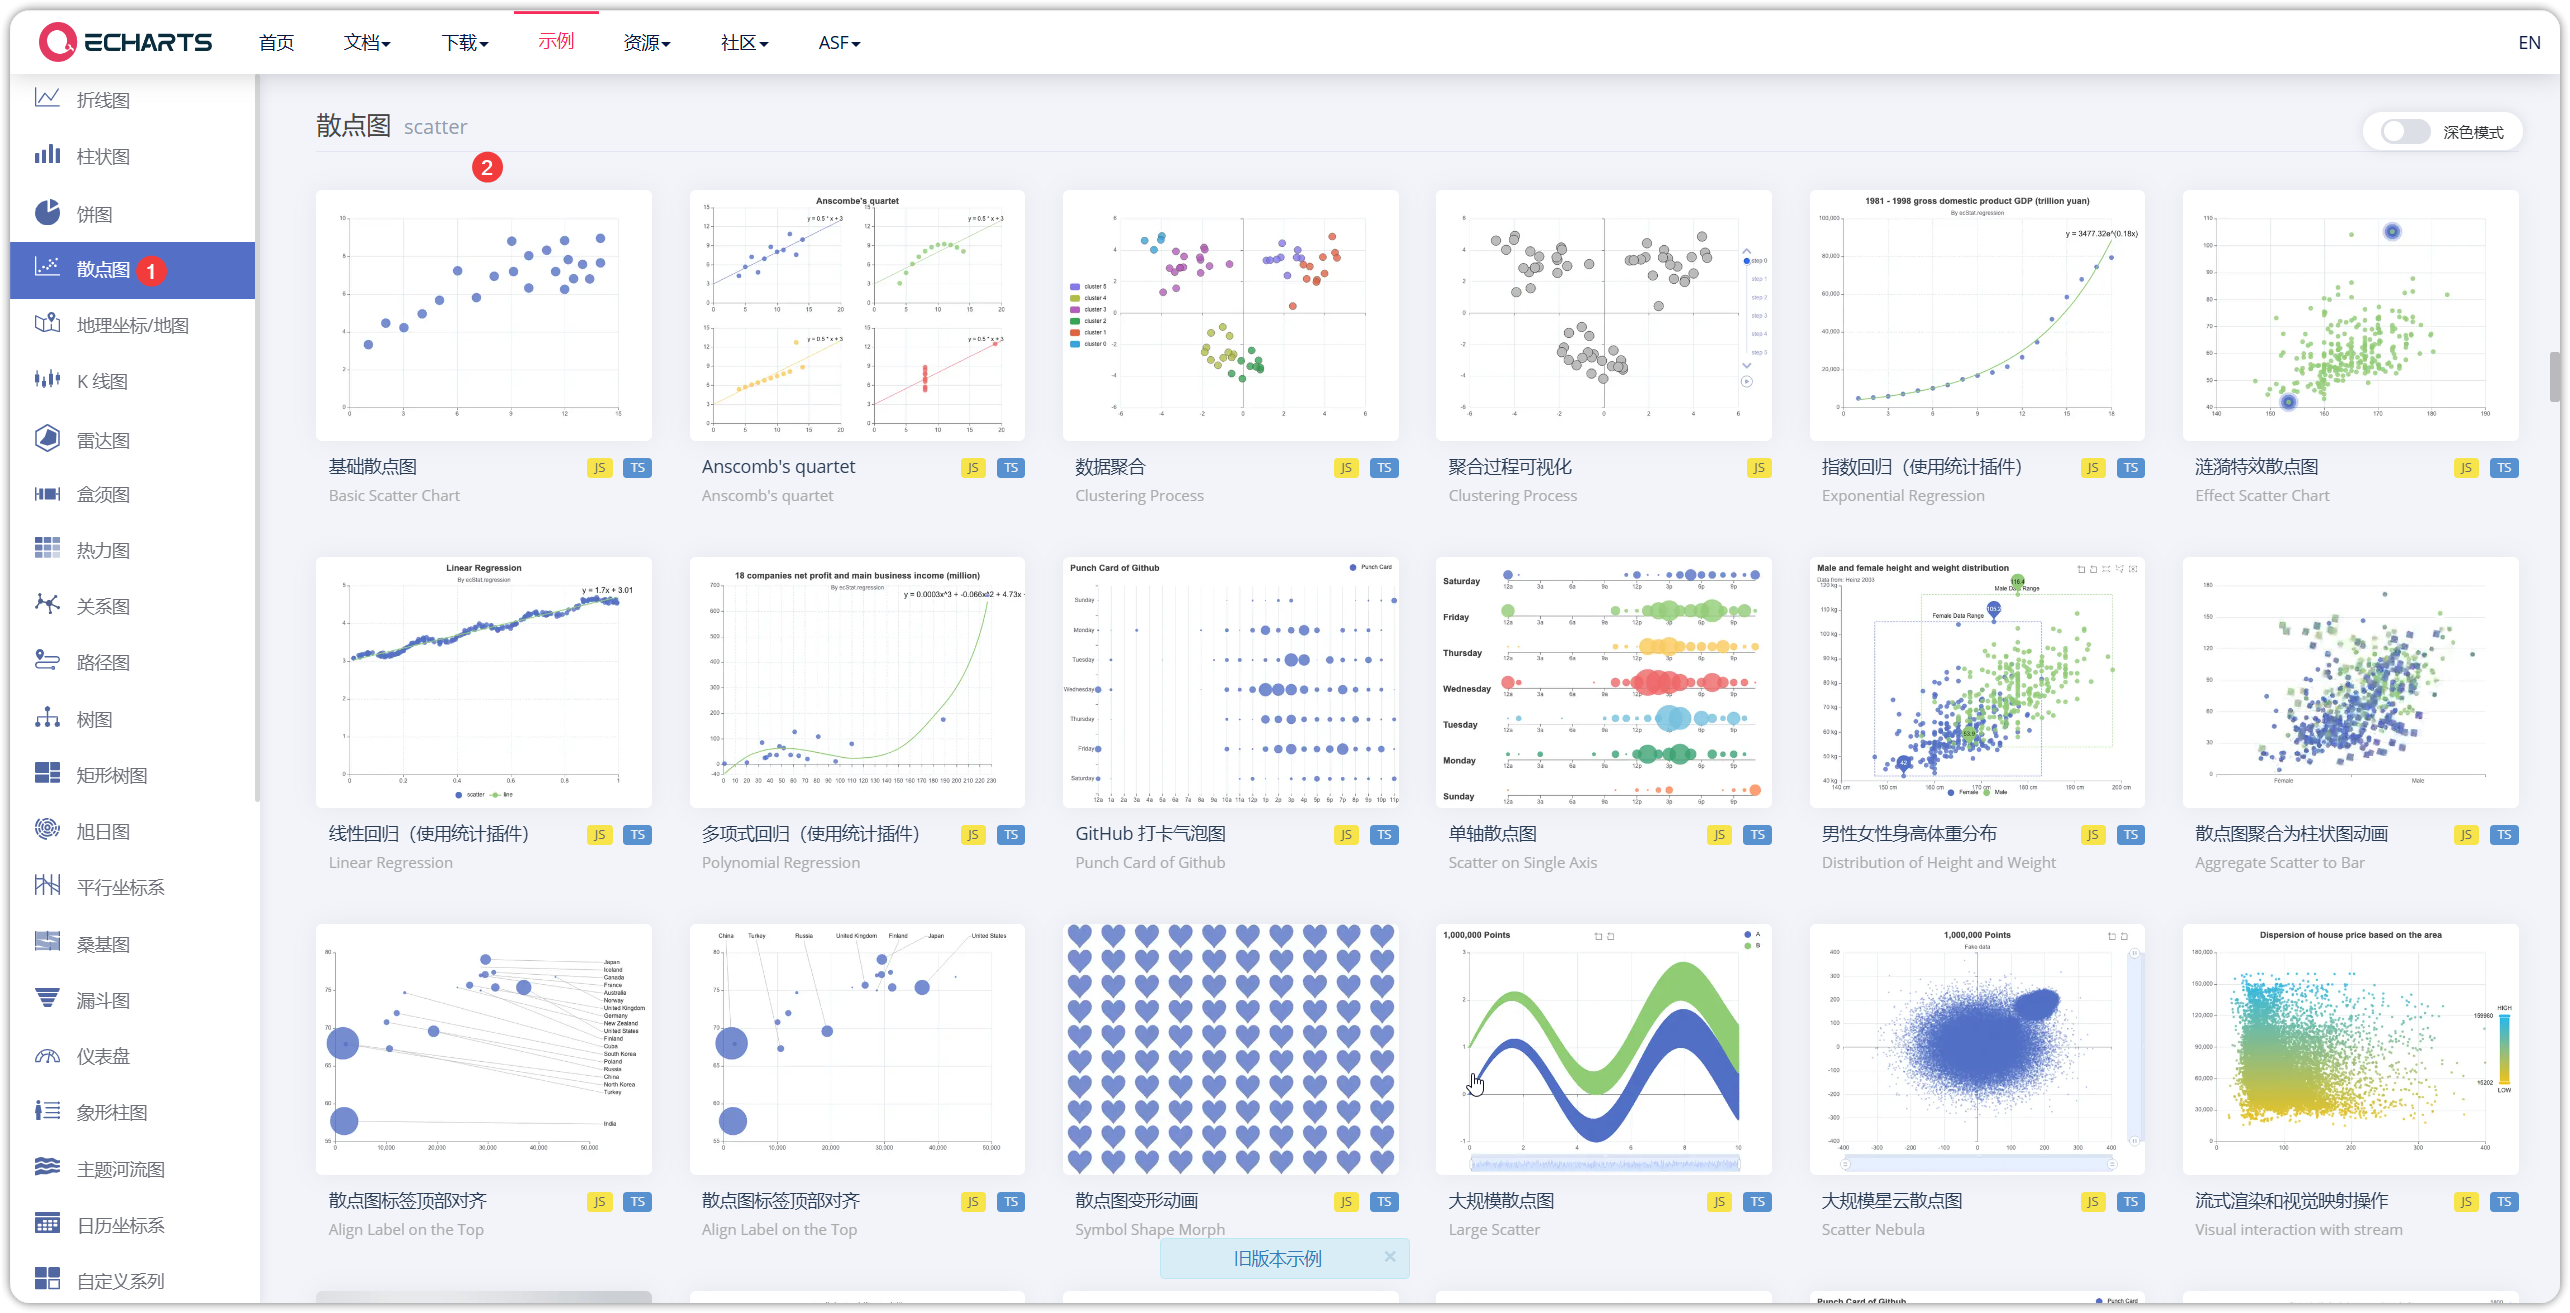
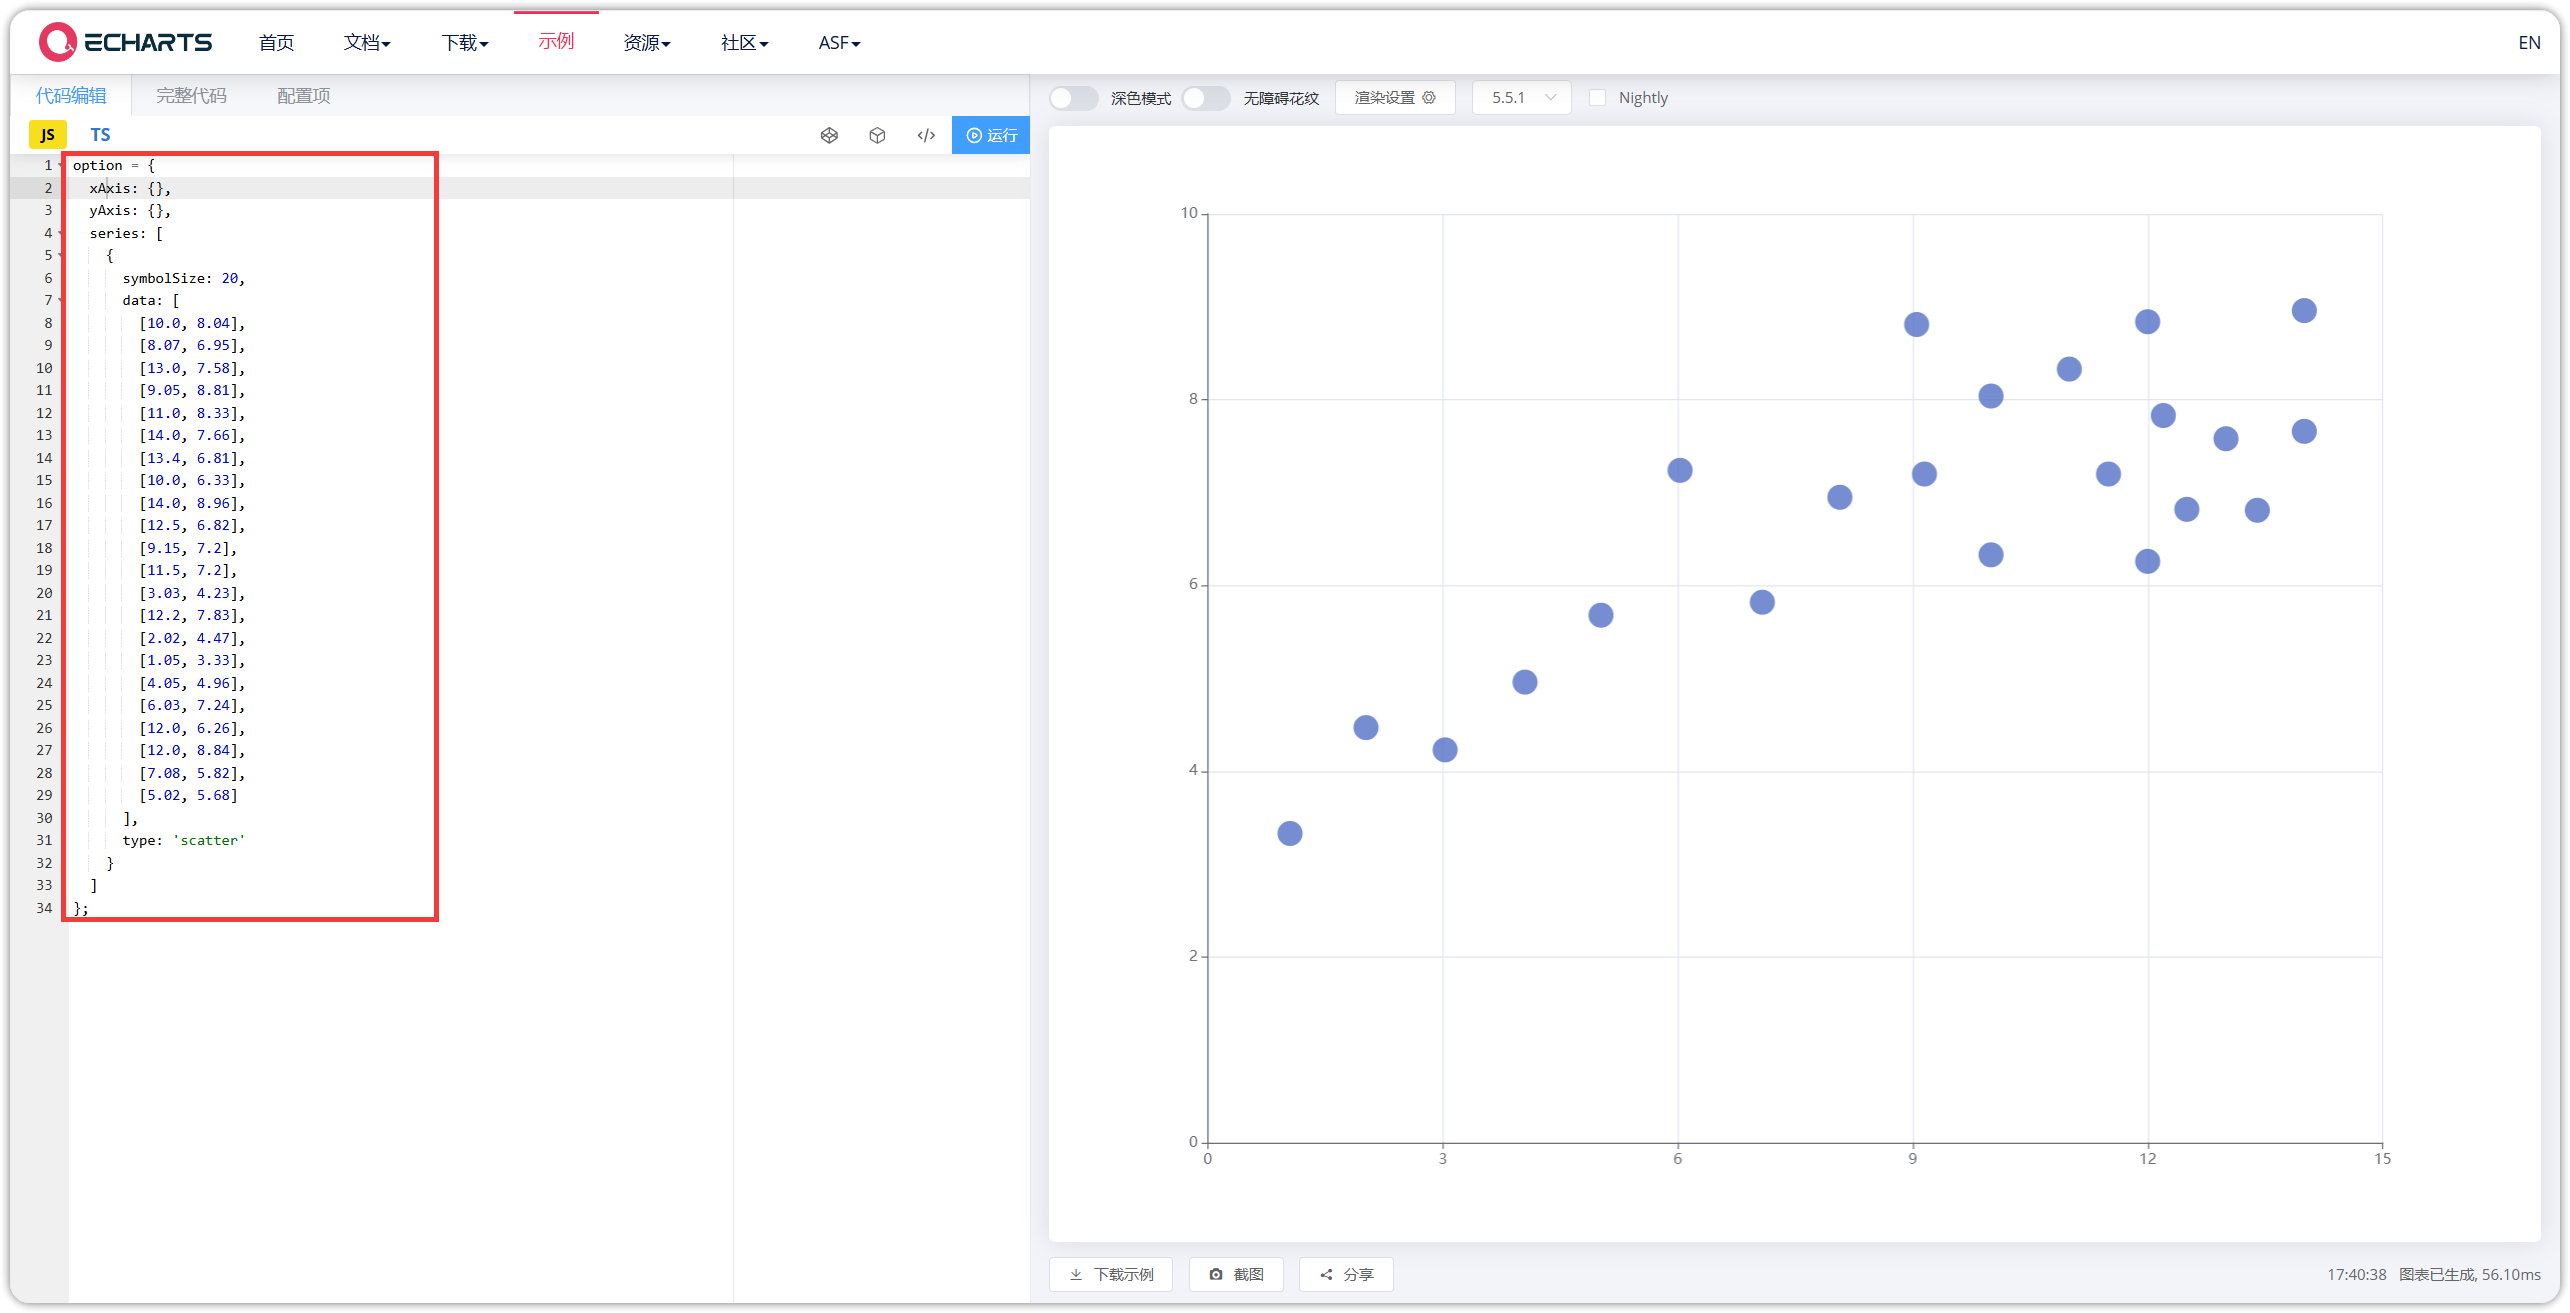
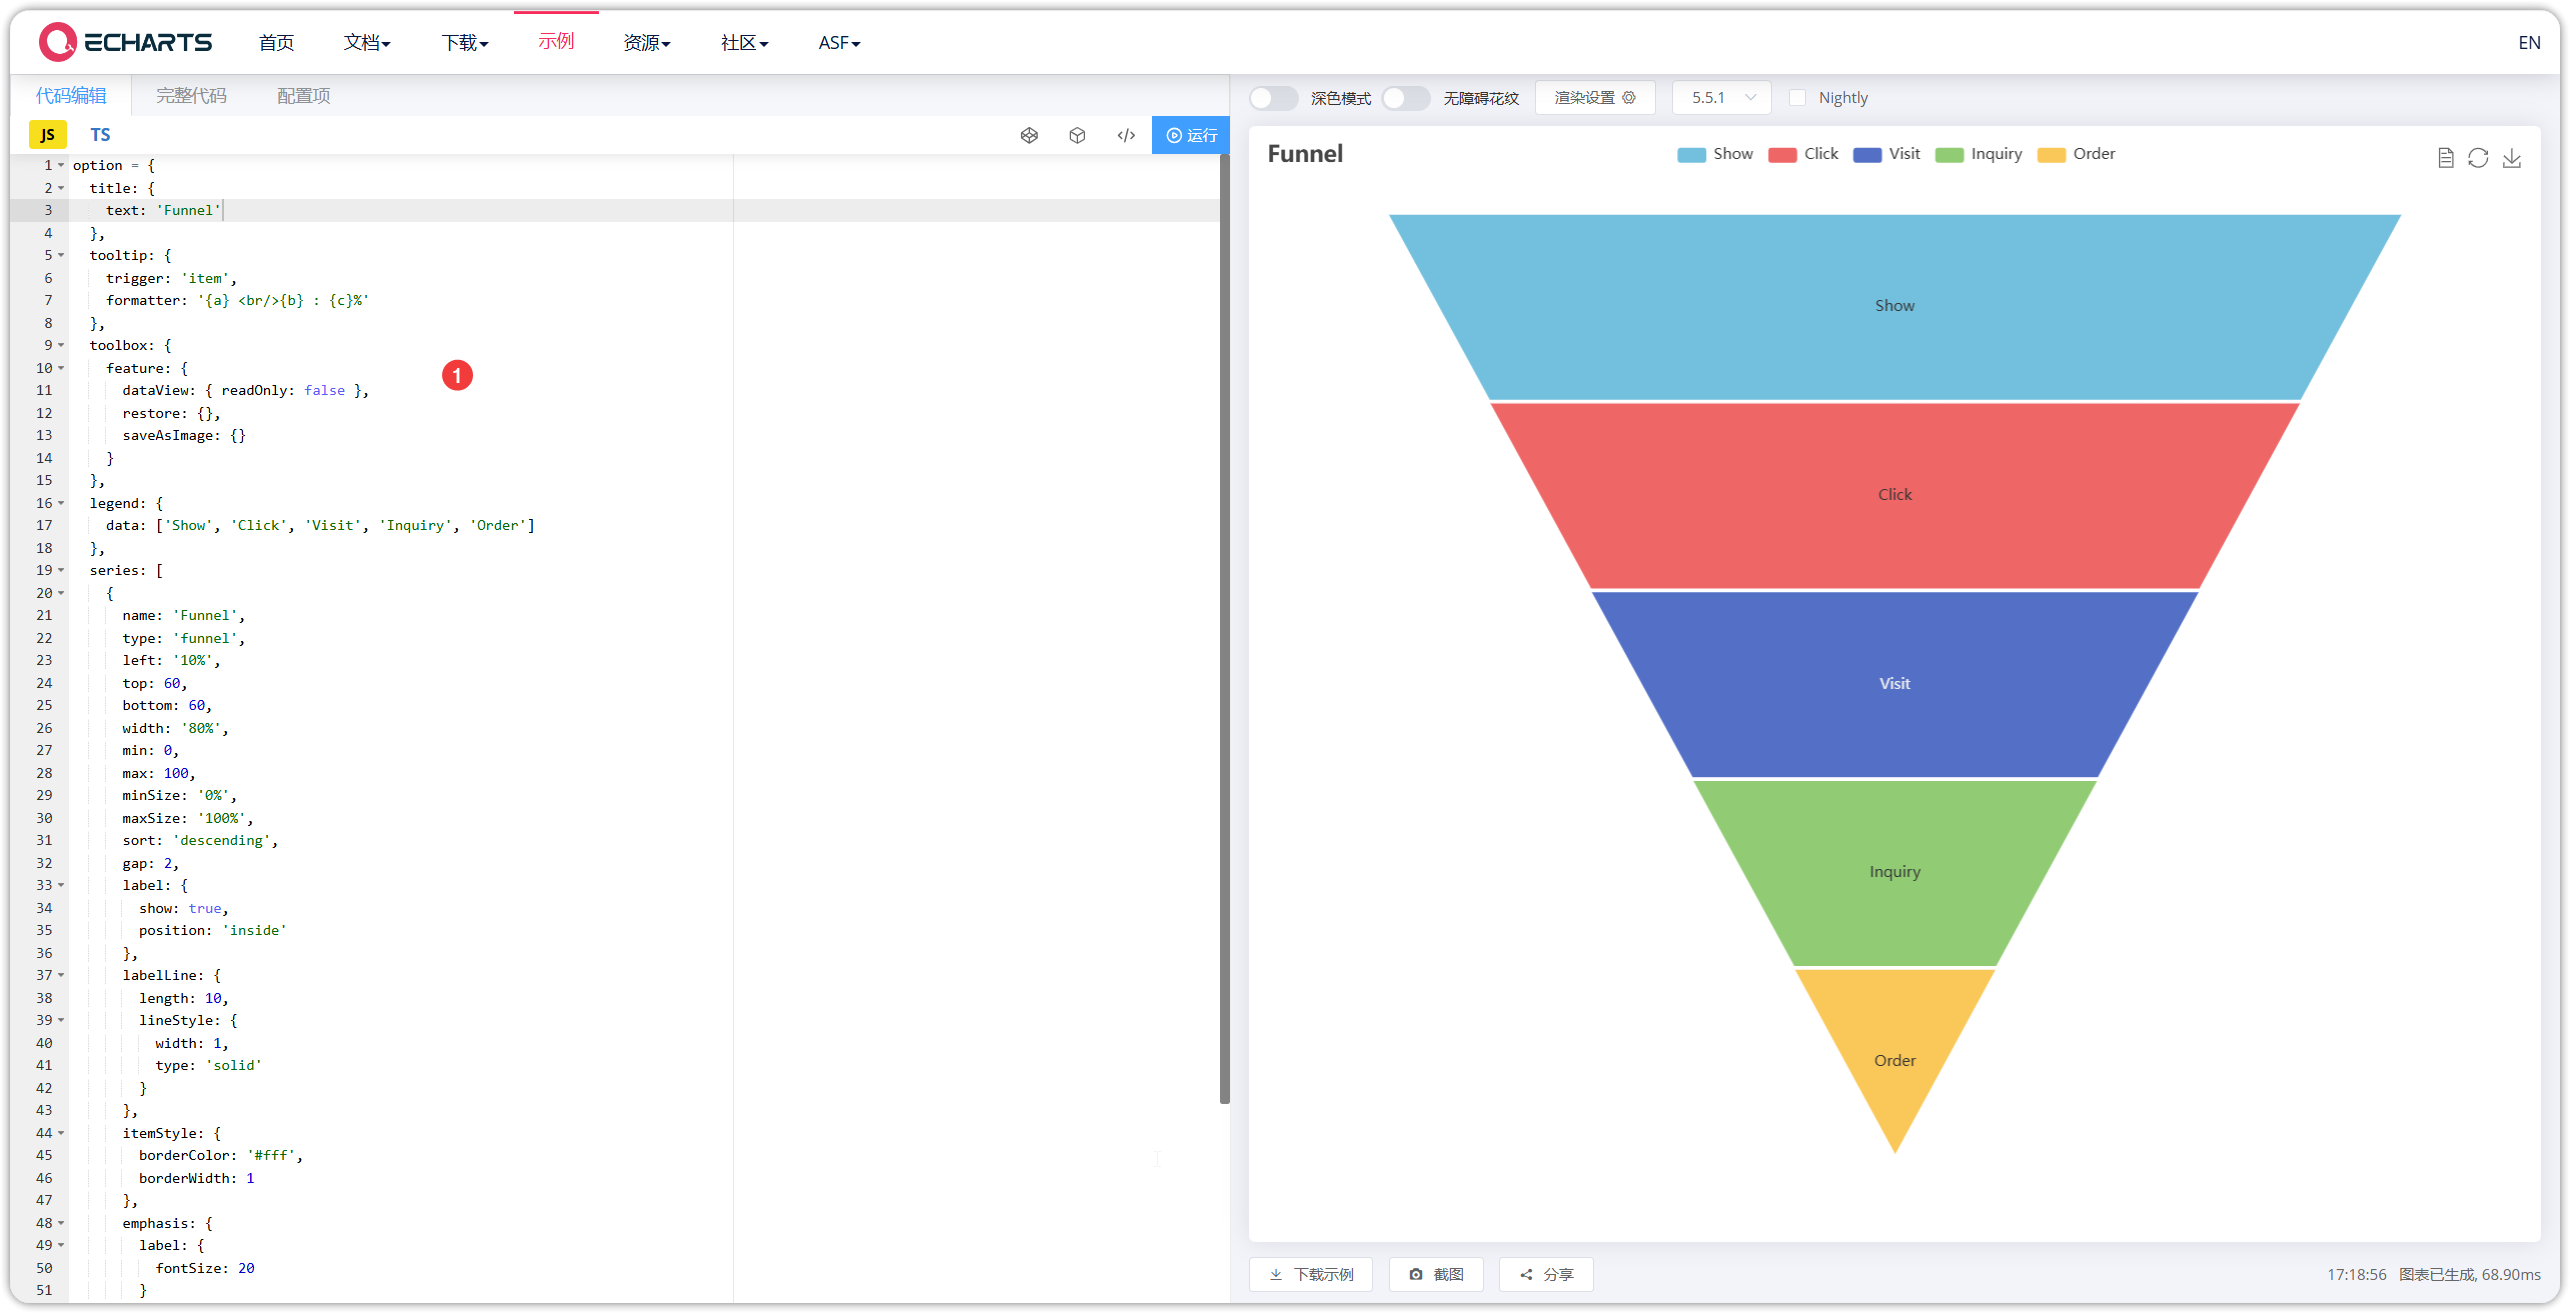
从 Apache ECharts 选择图表模板,复制其 option 值。
1.1 散点图
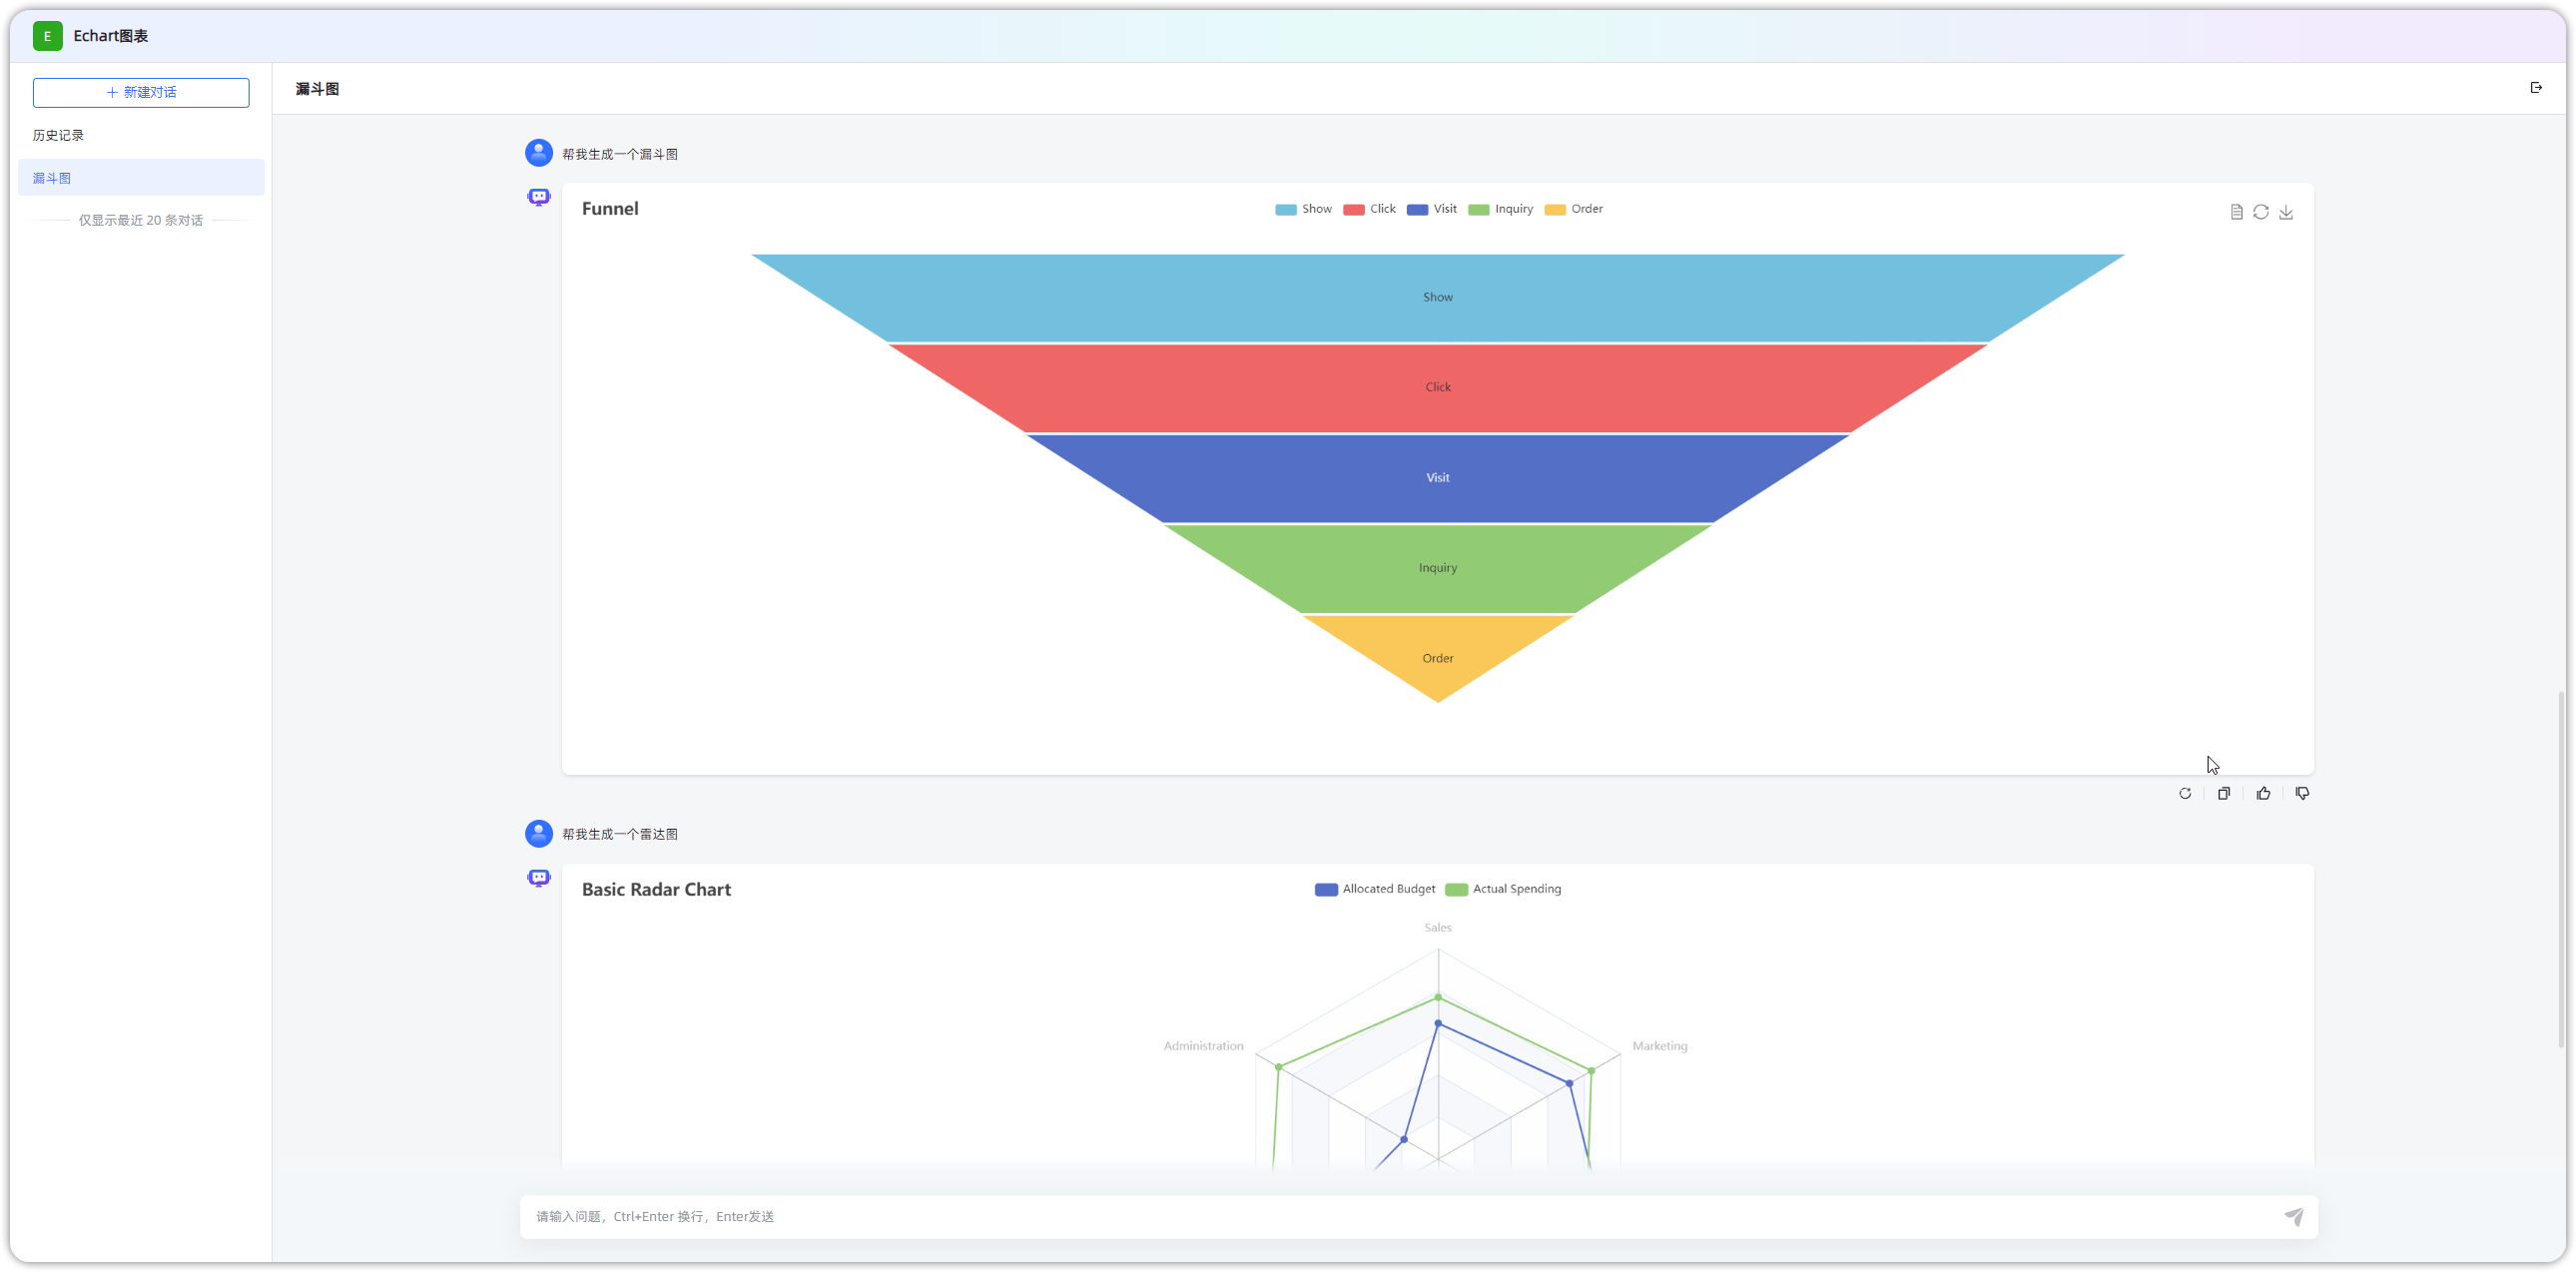
1.2 漏斗图

1.3 雷达图


2 函数
函数里返回的数据格式为 {'actionType': actionType, 'option': option, 'style': style}
actionType 表示执行类型,只有俩值:EVAL 或 JSON。如果 option 是一个 json,那么 actionType 就写 JSON ,如果 option 是一段需要执行的 js 那就用 EVAL。
option 表示图表,其值来自 Echart 模板中的 option,可以直接复制过来粘贴使用。
style 表示样式,即图表的长度、宽度。

3 函数库
# coding=utf-8
import json

def get_echarts():
    option = """
option = {
  title: {
    text: '专家库年龄分布图',
    subtext: '',
    left: 'center'
  },
  tooltip: {
    trigger: 'item'
  },
  legend: {
    orient: 'vertical',
    left: 'left'
  },
  series: [
    {
      name: 'Access From',
      type: 'pie',
      radius: '50%',
      data: [
        { value: 1048, name: 'Search Engine' },
        { value: 735, name: 'Direct' },
        { value: 580, name: 'Email' },
        { value: 484, name: 'Union Ads' },
        { value: 300, name: 'Video Ads' }
      ],
      emphasis: {
        itemStyle: {
          shadowBlur: 10,
          shadowOffsetX: 0,
          shadowColor: 'rgba(0, 0, 0, 0.5)'
        }
      }
    }
  ]
};
  """
    return json.dumps({'actionType': 'EVAL', 'option': option, 'style': {'height': '600px', 'width': '100%'}})

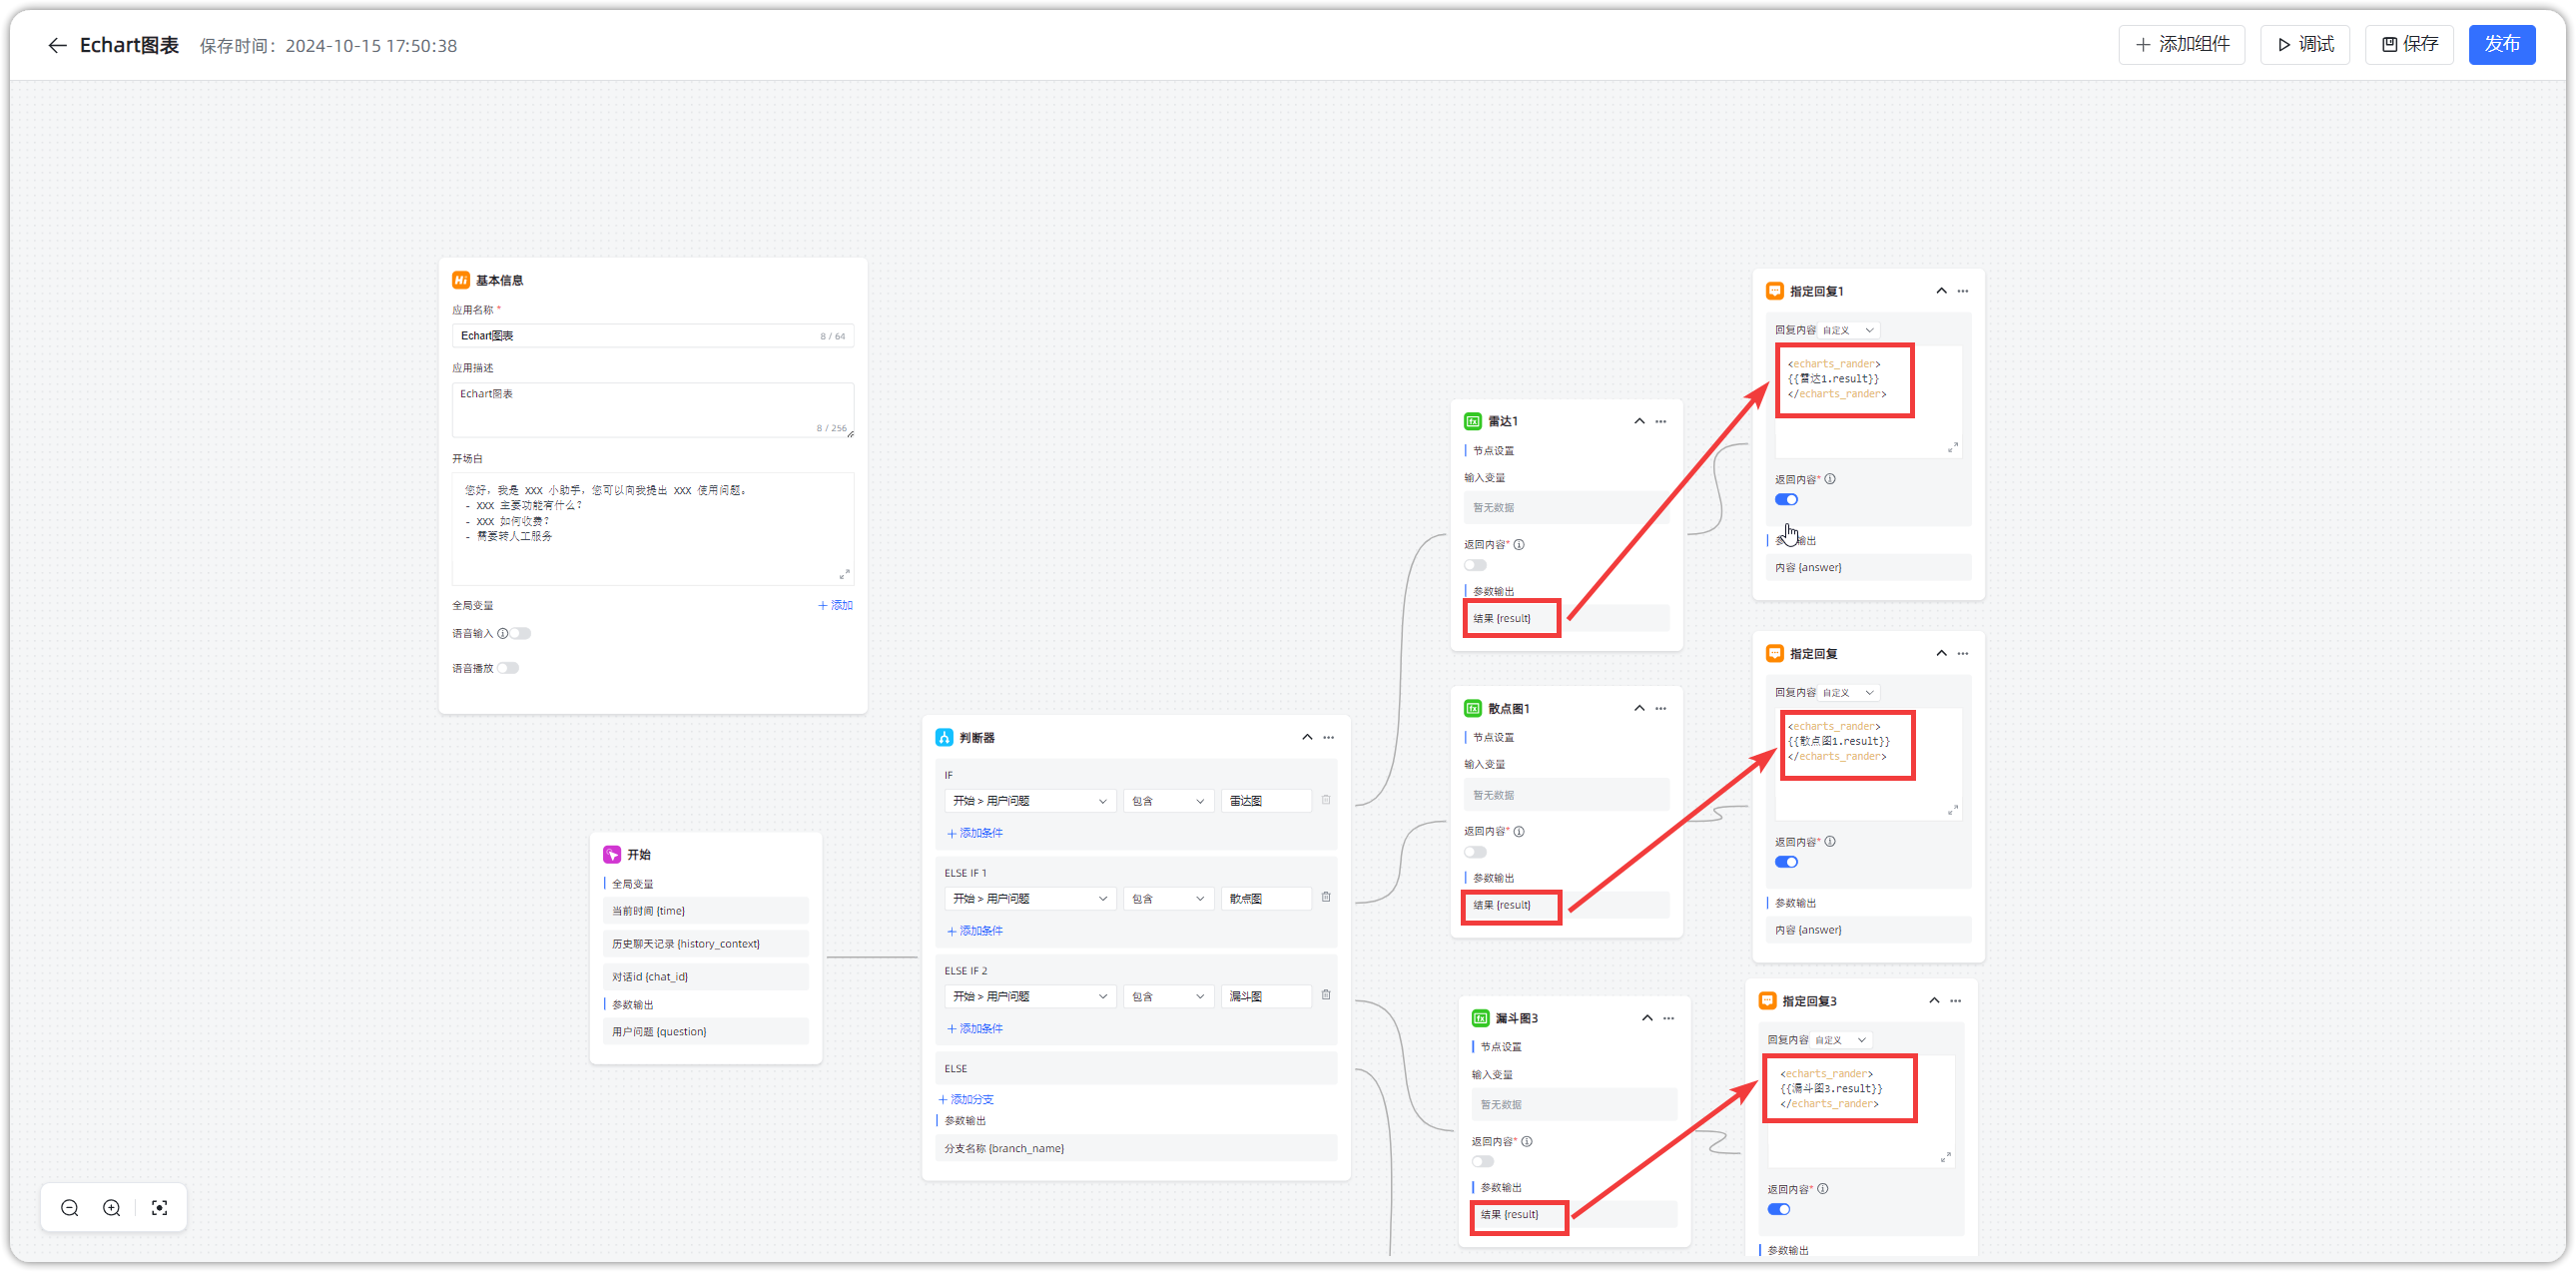
4 高级编排
场景:问题中若包含对应图表的名称,就调用对应函数,指定回复里输出 <echarts_rander></echarts_rander>结果。
5 小助手问答
6 图表切换表格
先在 Echart 里把如下内容贴进去。
option = {
  toolbox: {
           left:33,
           // top:10,
           feature: {
             dataView: {
               show: true,
               title: '数据视图',
               readOnly:true,
               lang: ['数据视图:', '返回'],    // 按钮
               contentToOption: function (opts) {
                 $(".echarts_max").table2excel({    //下载jquery.table2excel.js,引入,$("#tempChart")是Echarts容器
                     exclude: ".noExl", //过滤位置的 css 类名, 有class = “noExl” 的行不被导出
                     filename: "消耗量表", // 文件名称
                     name: "Excel Document Name.xls",
                     exclude_img: true,
                     exclude_links: true,
                     exclude_inputs: true
                 });
               },
               optionToContent: function (opt) {
               // console.log(opt)
                //该函数可以自定义列表为table,opt是给我们提供的原始数据的obj。 可打印出来数据结构查看
                var axisData = opt.xAxis[0].data; //坐标轴
                var series = opt.series; //折线图的数据
                var tdHeads =
                      '<td  style="margin-top:10px; padding: 0 15px">原料11</td>'; //表头
                var tdBodys = "";
                console.log(opt)
                series.forEach(function (item) {
                   tdHeads += `<td style="padding:5px 15px">消耗22</td>`;
                });
                var table = '<table border="1" style="margin-left:20px;border-collapse:collapse;font-size:14px;text-align:center;"><tbody><tr>'+tdHeads+'</tr>';
                for (var i = 0, l = axisData.length; i < l; i++) {
                   for (var j = 0; j < series.length; j++) {
                      // console.log(i+"-"+j+":"+series[j].data[i])
                      if (series[j].data[i] == null) {
                         tdBodys += `<td>${"-"}</td>`;
                      } else {
                         tdBodys += '<td>'+series[j].data[i]+'</td>';
                      }
                   }
                   table += '<tr><td style="padding: 0 15px">'+axisData[i]+'</td>'+tdBodys+'</tr>';
                   tdBodys = "";
                }
                table += "</tbody></table>";
                return table;
               },
             },
             magicType: {show: true, type: ['line', 'bar']},
             restore: {show: true},
             saveAsImage: {show: true}
           }
         },
  xAxis: {
    type: 'category',
    data: ['Mon', 'Tue', 'Wed', 'Thu', 'Fri', 'Sat', 'Sun']
  },
  yAxis: {
    type: 'value'
  },
  series: [
    {
      data: [150, 230, 224, 218, 135, 147, 260],
      type: 'line'
    }
  ]
};
点击执行,可以正常生成图表,点击数据视图按钮,进行图和表的切换。


将如上代码贴到函数库里。

高级编排里引用函数库进行调试,可以正常生成图形和表格。