需求:杭州市西湖区某小区已有统计居住人数数据,需要通过 DataEase V2 可视化出来。
一、绘制经纬度
方案一(免费,测试和精细描点):高德坐标拾取器(https://lbs.amap.com/tools/picker)(其他经纬度查询工具也可以),可以通过这个来查询经纬度信息,然后获取坐标点制作 json 文件
方案二:BigemapGIS Designer(付费工具,可以一键生成区域的真实地理信息),下载地址:http://www.bigemap.com/reader/download/
选择:方案一获取点的坐标。方案二可参考 https://kb.fit2cloud.com/?p=84 ,本文使用方案一方便测试功能人员和精细描点人员使用。
使打开高德坐标拾取器网址,认证登录后,在拾取器中搜索 杭州市西湖区 ,可以看到西湖区某个点的坐标。
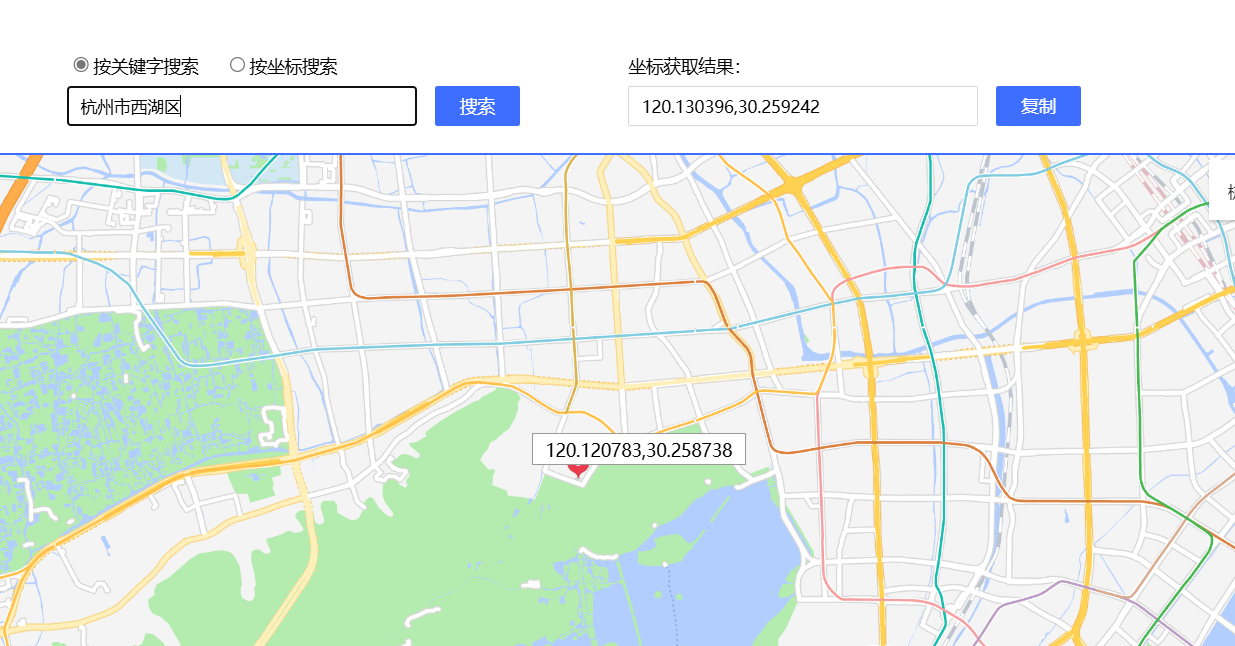
通过搜索 / 地图选点找到该小区的地址,获取坐标。
找到小区 1 中心,获取其坐标(120.120988, 30.241267)
切换到小区 1 的轮廓点,获取到一组坐标,最后一组坐标是第一个点的坐标,此时连成一个整体。
[
120.120962,
30.241278
],
[
120.120949,
30.241239
],
[
120.121020,
30.241239
],
[
120.121039,
30.241308
],
[
120.120962,
30.241278
]
依上述方法绘制小区 2 。
二、编辑脚本和测试
以杭州市西湖区某小区为例,找到杭州市西湖区的区域代码(156330106)和上级区域杭州市(156330100)。
可以在系统设置-地图设置看:

在服务器执行下列语句,复制 map 地图到服务器,方便编辑,并备份。
docker cp dataease:/opt/dataease2.0/data/map ./
#备份
mkdir ./mapbak/
docker cp dataease:/opt/dataease2.0/data/map ./mapbak/
cd 进入156 文件夹,找到这个 json ,使用 cat 156330106.json 查看。提示:可以把 156330106.json 传到 windows 使用编辑器看,比较直观。
(1)修改156330106.json 汇总小区1、小区2 的中心坐标(center、centroid)和边缘坐标信息(coordinates)到西湖区来:
{
    "type": "FeatureCollection",
    "features": [
        {
            "type": "Feature",
            "properties": {
                "adcode": 33010601,
                "name": "小区1",
                "center": [
                    120.120988,
                    30.241267
                ],
                "centroid": [
                    120.120988,
                    30.241267
                ],
                "childrenNum": 0,
                "level": "distinct",
                "acroutes": [
                    330106
                ],
                "parent": {
                    "adcode": 330106
                }
            },
            "geometry": {
                "type": "MultiPolygon",
                "coordinates": [
                    [
                        [
                            [
                                120.120962,
                                30.241278
                            ],
                            [
                                120.120949,
                                30.241239
                            ],
                            [
                                120.121020,
                                30.241239
                            ],
                            [
                                120.121039,
                                30.241308
                            ],
                            [
                                120.120962,
                                30.241278
                            ]
                        ]
                    ]
                ]
            }
        },
        {
            "type": "Feature",
            "properties": {
                "adcode": 33010602,
                "name": "小区2",
                "center": [
                    120.121397,
                    30.241237
                ],
                "centroid": [
                    120.121397,
                    30.241237
                ],
                "childrenNum": 0,
                "level": "distinct",
                "acroutes": [
                    330106
                ],
                "parent": {
                    "adcode": 330106
                }
            },
            "geometry": {
                "type": "MultiPolygon",
                "coordinates": [
                    [
                        [
                            [
                                120.121350,
                                30.241288
                            ],
                            [
                                120.121442,
                                30.241287
                            ],
                            [
                                120.121443,
                                30.241234
                            ],
                            [
                                120.121340,
                                30.241221
                            ],
                            [
                                120.121350,
                                30.241288
                            ]
                        ]
                    ]
                ]
            }
        }
    ]
}
(2)替换地图文件
docker cp ./156330106.json dataease:/opt/dataease2.0/data/map/156/(3)测试
刷新浏览器,测试数据:
.png)
制作仪表板测试:
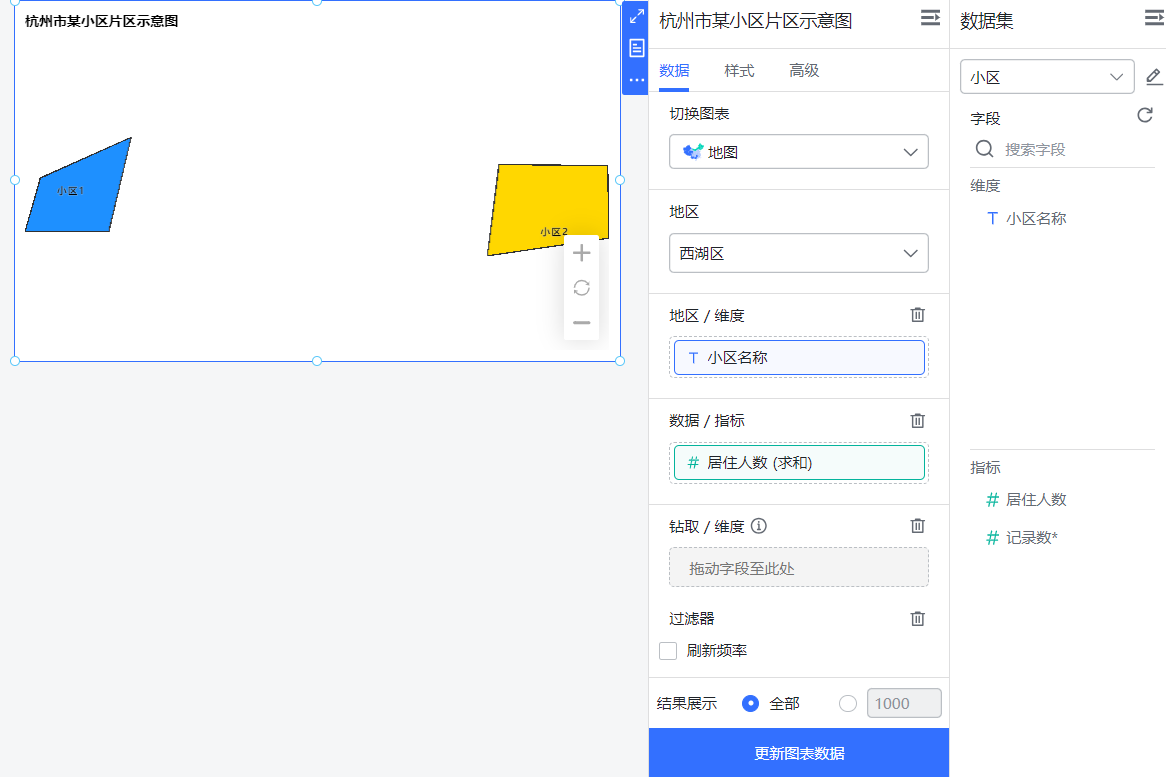
三、单独展示一个小区/下钻
如果需要单独显示一个小区的信息,同理,继续向下定义小区,然后上级填写西湖区。
(1)定义小区栋
如下,复制 156330106.json 到本地,然后修改为 15633010601.json 和 15633010602.json 两个文件
小区1栋 15633010601.json
{
    "type": "FeatureCollection",
    "features": [
        {
            "type": "Feature",
            "properties": {
                "adcode": 33010601,
                "name": "小区1",
                "center": [
                    120.120988,
                    30.241267
                ],
                "centroid": [
                    120.120988,
                    30.241267
                ],
                "childrenNum": 0,
                "level": "distinct",
                "acroutes": [
                    330106
                ],
                "parent": {
                    "adcode": 330106
                }
            },
            "geometry": {
                "type": "MultiPolygon",
                "coordinates": [
                    [
                        [
                            [
                                120.120962,
                                30.241278
                            ],
                            [
                                120.120949,
                                30.241239
                            ],
                            [
                                120.121020,
                                30.241239
                            ],
                            [
                                120.121039,
                                30.241308
                            ],
                            [
                                120.120962,
                                30.241278
                            ]
                        ]
                    ]
                ]
            }
        }
    ]
}
小区2栋 15633010602.json
{
    "type": "FeatureCollection",
    "features": [
        {
            "type": "Feature",
            "properties": {
                "adcode": 33010602,
                "name": "小区2",
                "center": [
                    120.121397,
                    30.241237
                ],
                "centroid": [
                    120.121397,
                    30.241237
                ],
                "childrenNum": 0,
                "level": "distinct",
                "acroutes": [
                    330106
                ],
                "parent": {
                    "adcode": 330106
                }
            },
            "geometry": {
                "type": "MultiPolygon",
                "coordinates": [
                    [
                        [
                            [
                                120.121350,
                                30.241288
                            ],
                            [
                                120.121442,
                                30.241287
                            ],
                            [
                                120.121443,
                                30.241234
                            ],
                            [
                                120.121340,
                                30.241221
                            ],
                            [
                                120.121350,
                                30.241288
                            ]
                        ]
                    ]
                ]
            }
        }
    ]
}
(2)执行替换
docker exec -it dataease mkdir /opt/dataease2.0/data/map/geo
docker cp ./15633010601.json   dataease:/opt/dataease2.0/data/map/156/
docker cp ./15633010602.json   dataease:/opt/dataease2.0/data/map/156/
(3)上传经纬度
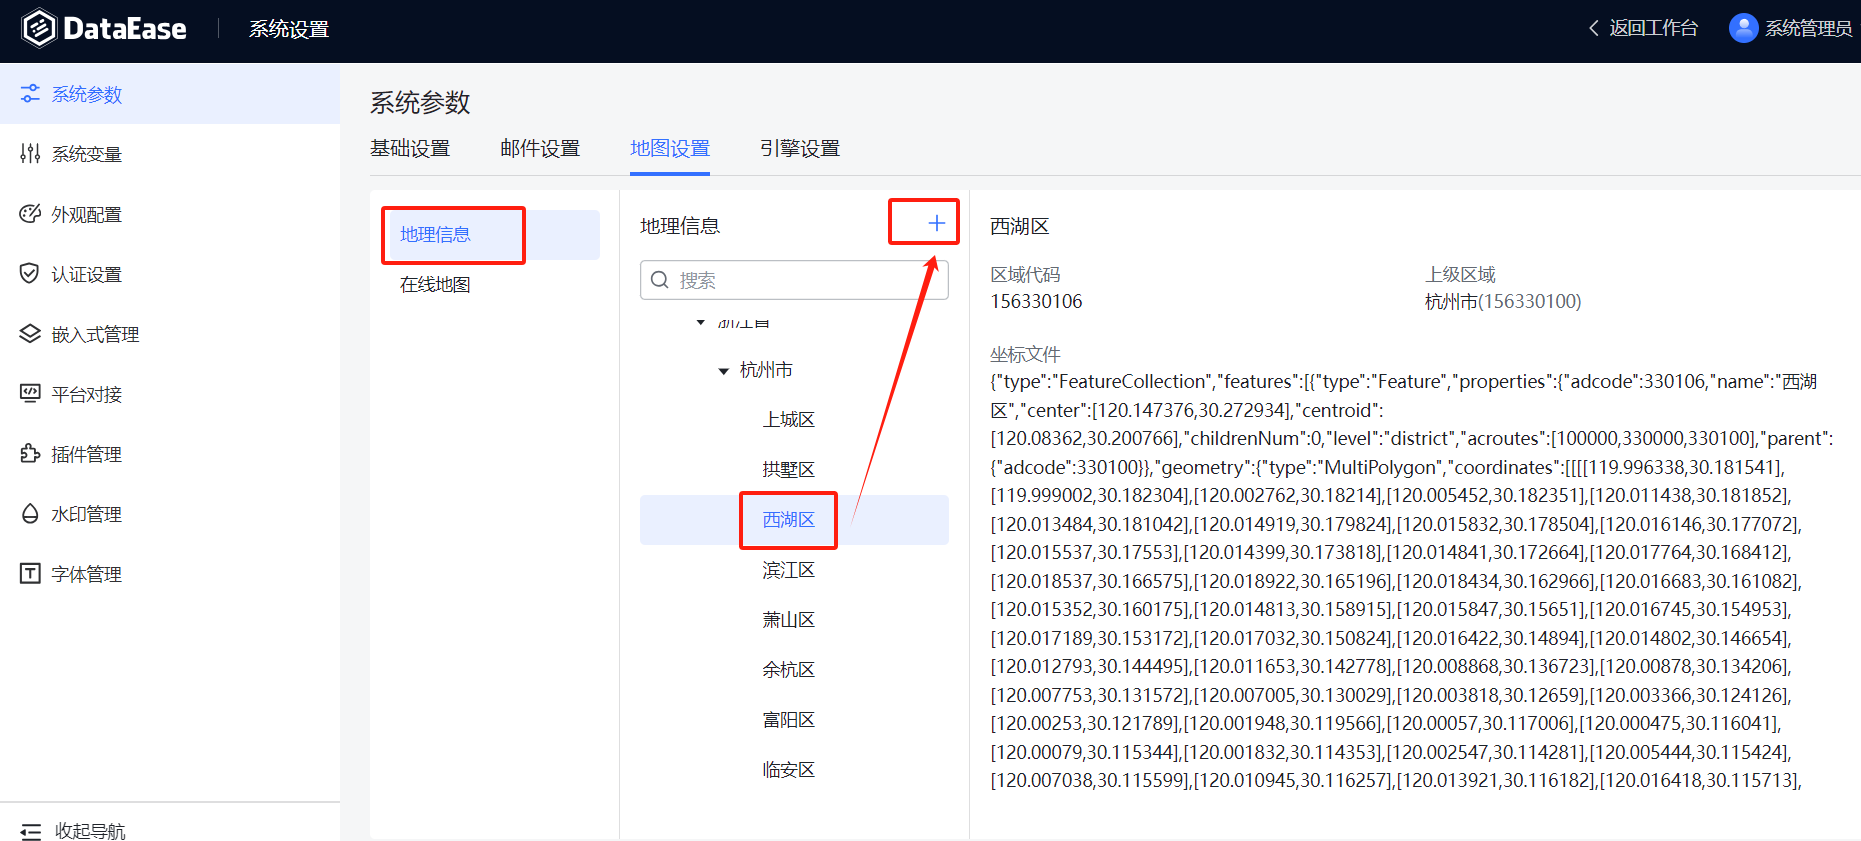
填写:西湖区区域代码15633010601和02,分别上传小区
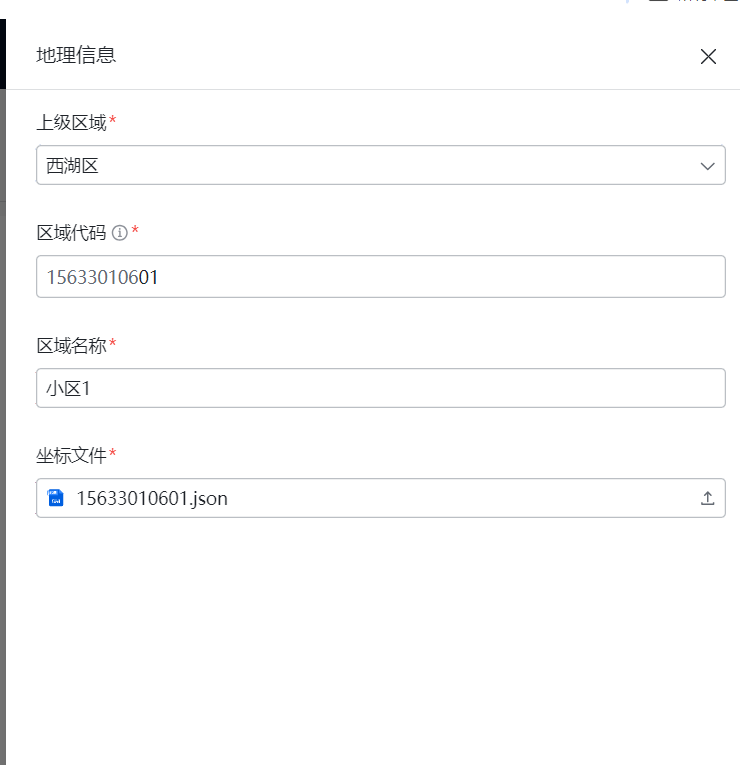
添加成功:
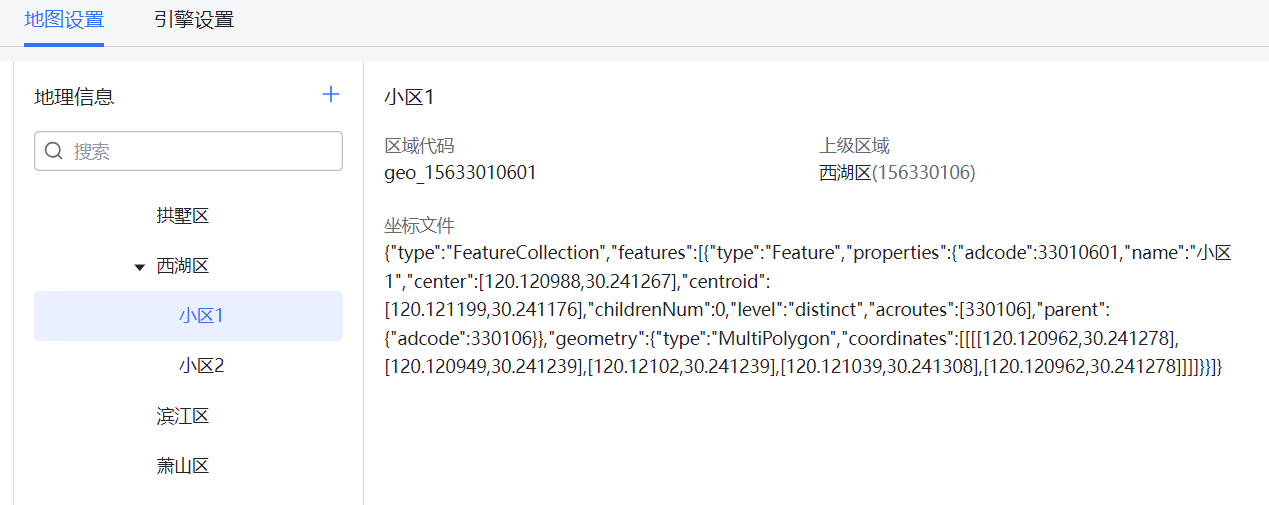
图表已经可以选择,选择小区示例完成。
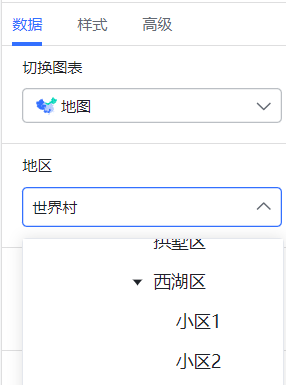
需要更多细节区域分割可以自己绘制,西湖区下是乡镇级别(最底的级别),因此对于小区里面的细节,可以在小区级别绘制,但不能再下钻(如不能小区下砖到设施位置),此时可以考虑在根级别(如世界地图、中国地图 156 下设置小区,可继续下钻)。